On Ecological Health and Ecoliteracy:
How the Ecological Health Indicator (EHI) Can Help Us Literally See the Ecosystem Processes When We Look at the Land
Chasing the Comet’s Tail
Wherever life exists on planet Earth on land or at sea, it creates interconnected webs woven together out of sunlight, water, minerals, and the dynamic community of the various life forms that inhabit any particular place.
These webs all have their own characteristic depth and complexity and the presence of certain marker species give us an insight into the relative health of the biodiversity of an ecosystem.
The webs of life also leave behind traces of their activities which includes the stable carbon deposits in soils. And there are other qualities and characteristics like the water infiltration rate which can give us an understanding of how well functioning an ecosystem might be.
However, what these kinds of markers, traces, characteristics and qualities have in common is that they are all part of the comet’s tail of life which travels through the weave and web of the ecosystem, and this is why they are also sometimes called lagging indicators. They lag behind the curve of life. They are a consequence of it, not the strength of it.
Up Close to the Pattern of Life
There is another group of indicators which can tell us about the comet’s head itself which creates that life, which creates that biodiversity, which leaves behind the trace of stable carbon deposits, which causes the water infiltration capacity of soils to increase. These indicators are called leading indicators because they get us close to the spearhead of life, up close to the moment where sunlight, water, minerals and the community dynamics of species blend to create the pattern that is life.
Leading indicators give us insights into an ecosystem’s generative flow of sunlight into the landscape (not just the amount of solar radiation), the effectiveness of the rainfall where it falls in that landscape (not just the amount of rainfall), the capacity of that ecosystem to cycle minerals through its web of life, and the maturity of the dynamics of the community of living things within that ecosystem.
Leading indicators tell us about the strength of that force which puts life into the landscape, which puts the carbon in the ground, which expands or contracts biodiversity. Leading indicators give us insight into how well the four ecosystem processes of solar flow, the water cycle, the mineral cycle, and community dynamics are functioning in support of life.
Photosynthesis as the Baseline of Life
While other parameters may differ widely, e.g., terrain, temperature, availability of water, geology, across planet Earth to create the different habitats, eco- and bioregions and so on, they must always allow for the four ecosystem processes in order to make life possible.
The baseline of life from the perspective of the leading indicators is the presence of (green) plants to enable the magic of photosynthesis. Without plants, their presence in functional groups and the products of the process of photosynthesis through them, no web of life may emerge.
Farming processes are often poorly organised from the perspective of life and ecosystem health. However, it is also possible not only to come to see that our actions as land-stewards necessarily interact with the life of the landscape we are a part of. We can go beyond and design our farming practices to enhance the ecosystem processes, to increase the complexity of the ecologies we serve, to boost the nutrient density of the food we grow, and to raise the quality of all life in the process of farming the food we eat and the fibres we wear and use.
A Generative Footprint Follows the Eye That Sees the Patterns of Life
This awareness of the ecosystem processes and how our actions affect them, is one of the most empowering capacities for human beings. It allows us to understand that we can use our footprint to design ways of being that have a positive impact on the health of life. In fact, it is possible to measure and put a number on the health of the ecosystems and their processes we are a part of. This number is called the Ecological Health Index (EHI) which measures fifteen leading indicators to give access to the functioning of the four ecosystem processes. Tools like the EHI are the very basis of true ecoliteracy. It has the power to help us see the ecosystem processes when we look at a landscape.
By understanding how ecosystem health functions and how it brings together the four vital processes, we are able to appreciate what the maximum health of a landscape looks like across all of its ecosystem states, e.g., woodland, wooded grassland, heathland, ruderals, grasslands, arable land etc. Suddenly, we move from small incremental gains which focus on single species or metrics to realising what the gap is between the current state and the full potential of the ecosystem we are a part of.
What Is It That You See When You Look At the Land?
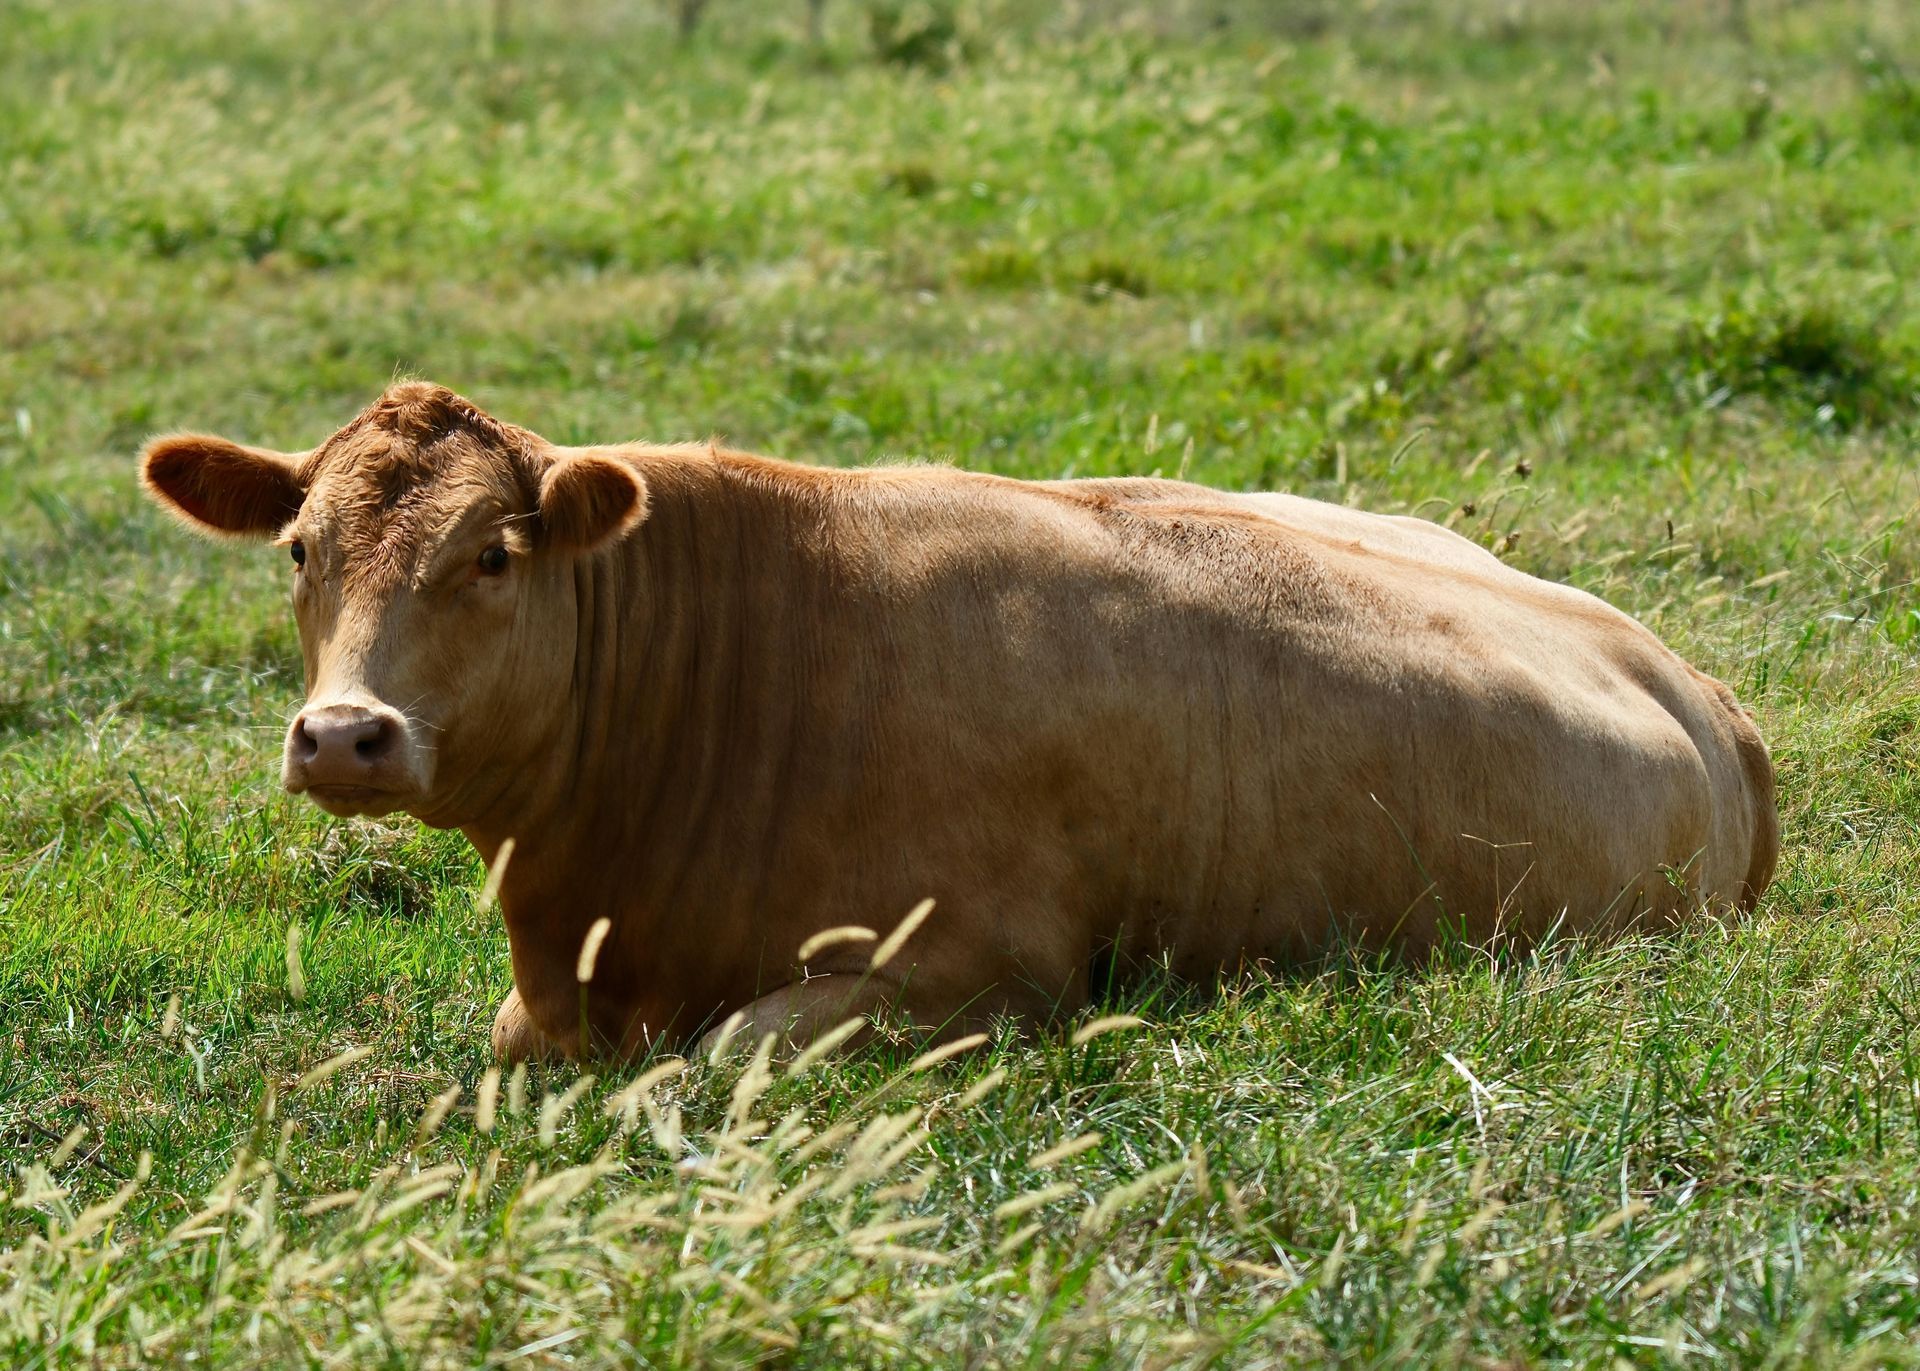
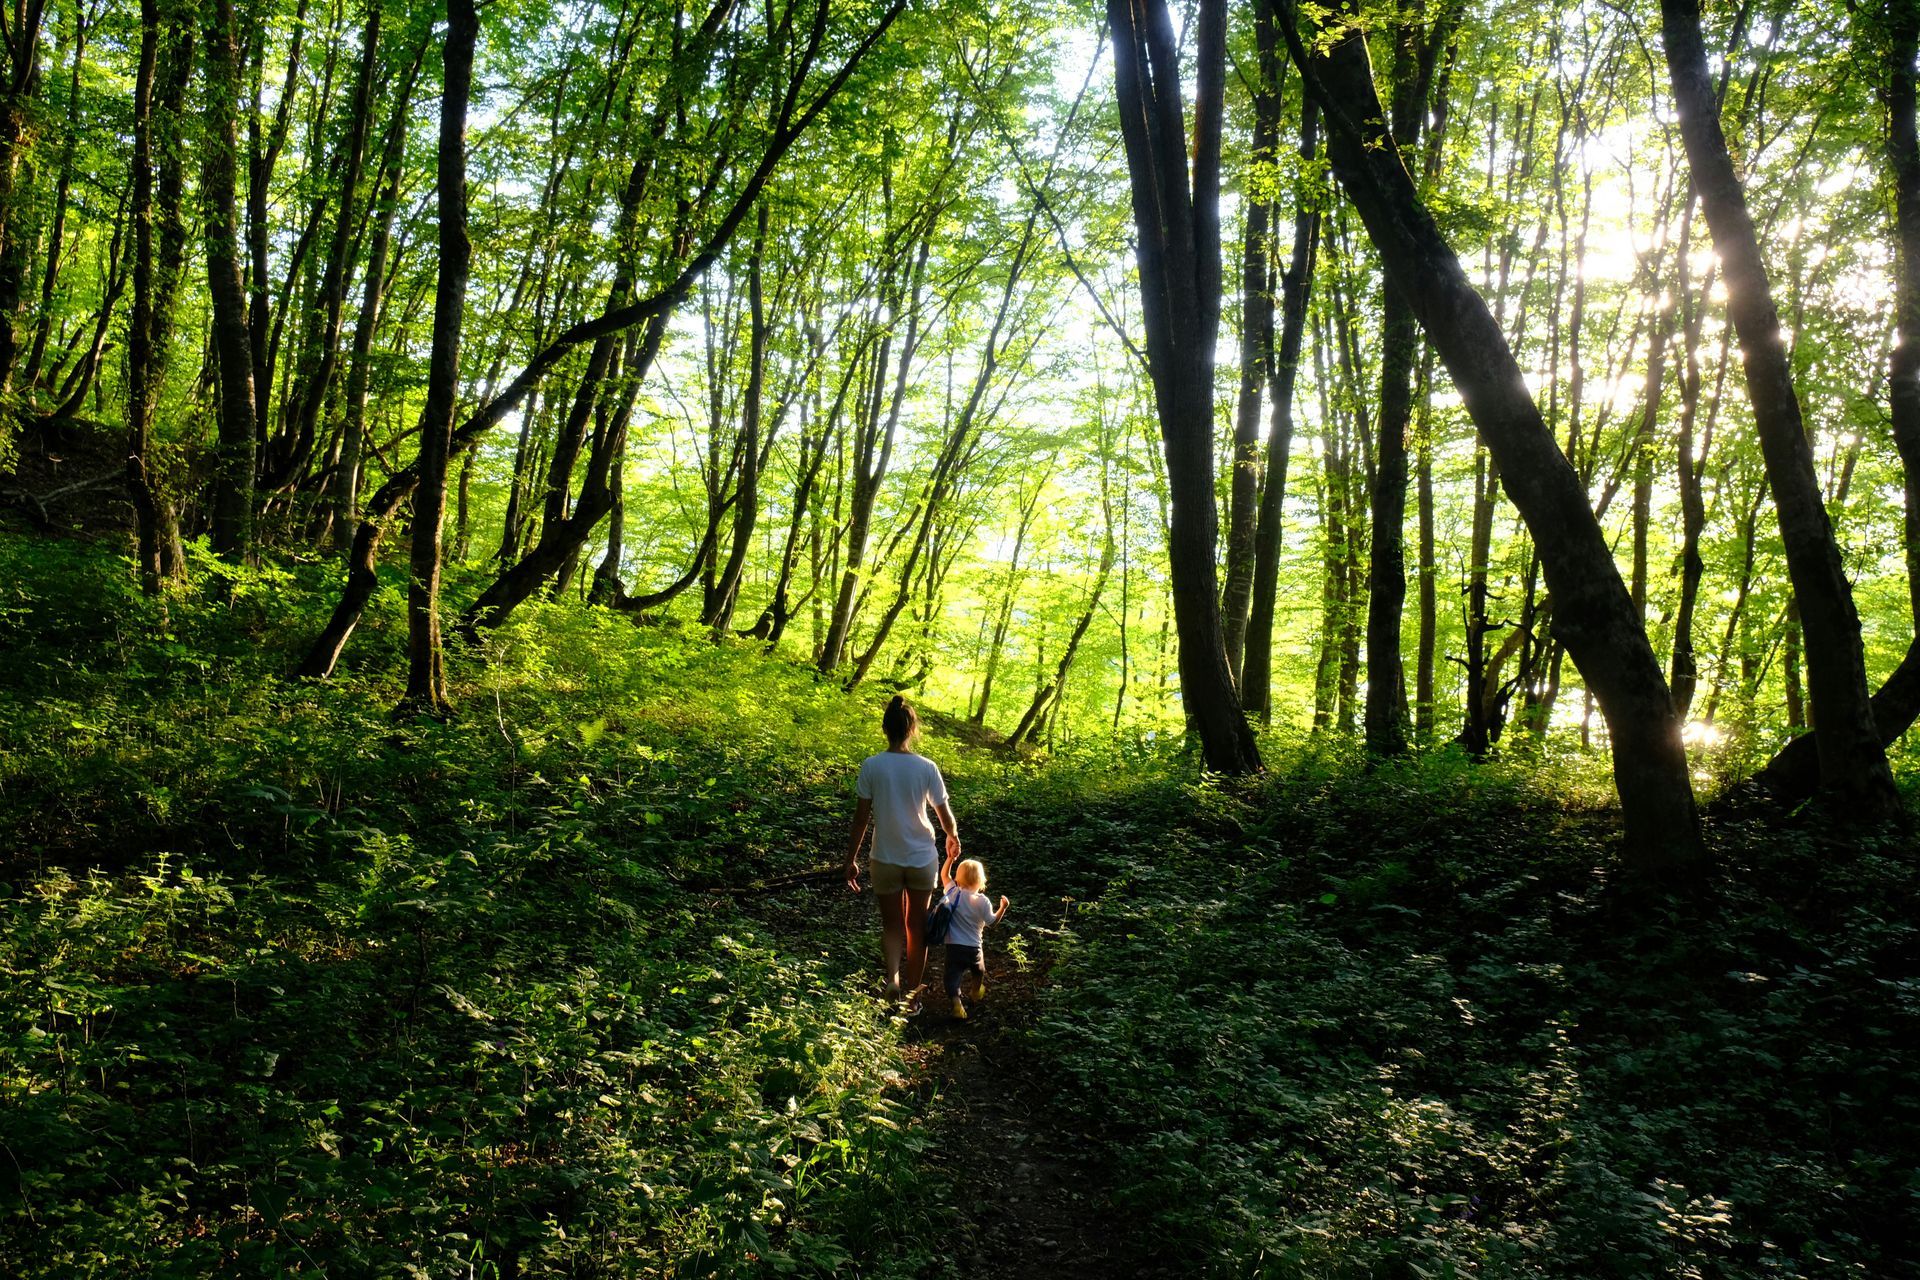
Enter the field of life. Look down to your feet.
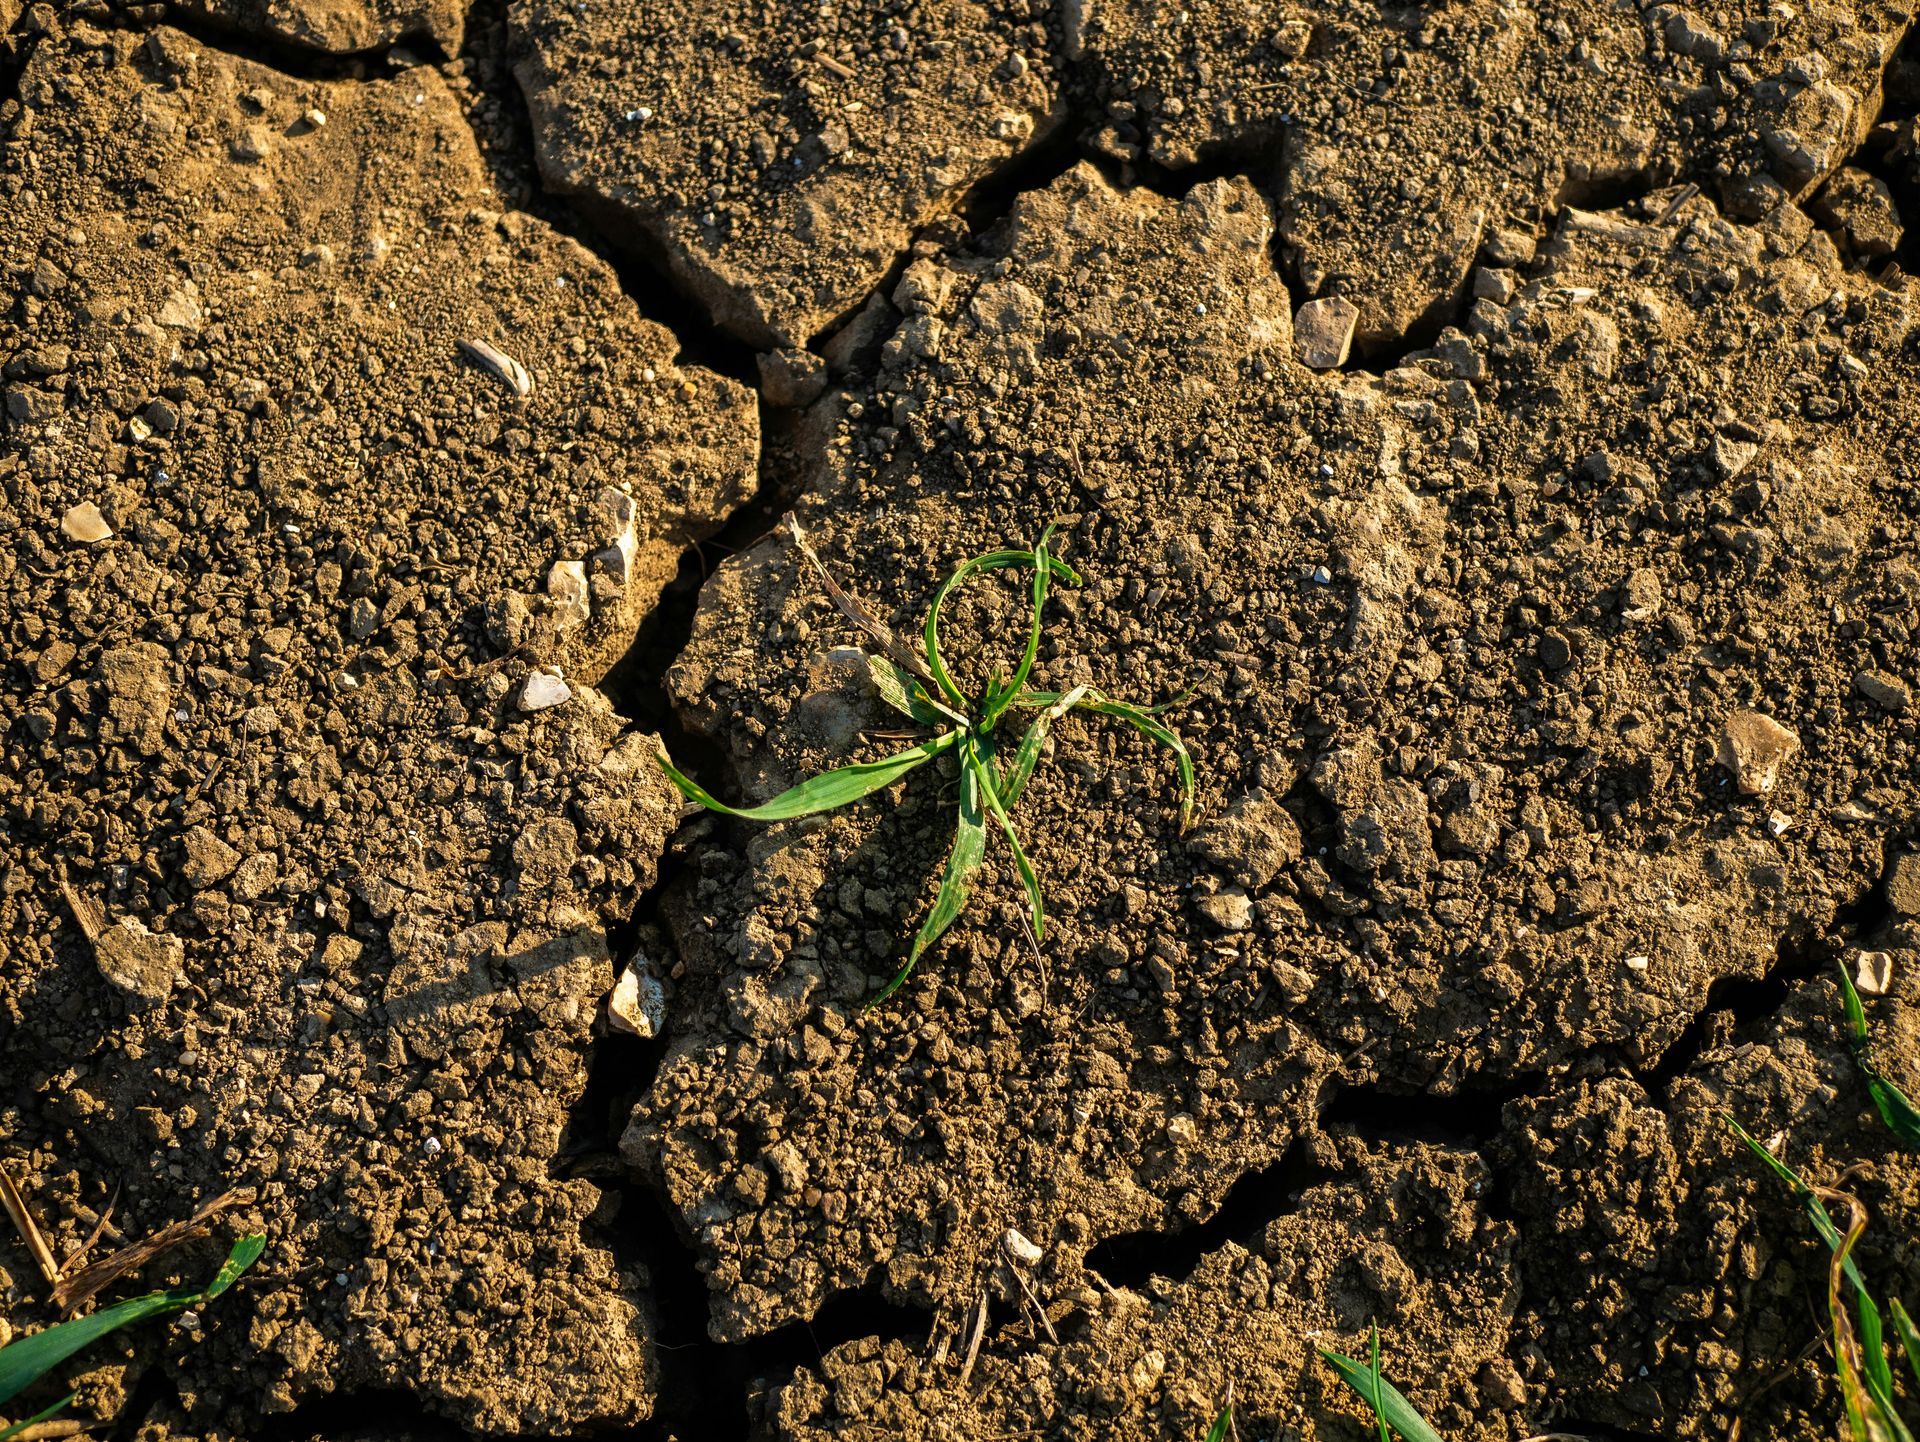
Bare soil is the greatest sign of poor health of the land. Is the soil exposed and bare, without plant cover or litter cover? Or is the soil you protected from rain and sun? If bare, is it hard and crusty so that it prevents water infiltration? Scratch the soil. Is it hard? Would it resist infiltration? That’s a capped surface.
What about wind erosion? Has the soil even blown away? Can you see soil deposits blown behind vegetation and on the leeward side of fence posts or stones? Look for blowouts, dust scours, or little soil dunes near shrubs or fences.
What about water erosion?
Has water carried away soil and shaped rills and gullies or pedestals? Can you see patterns among the vegetation that indicate water collecting and flowing? Often there is a colour change in the plants that have experienced water flow. There’ll be channels and soil loss pathways formed by water. Plant litter will have accumulated along flow lines. There’ll be exposed roots and maybe exposed gravel.
Now scan for fallen leaf litter and other dead plant material like dry grasses. Is there a protective layer, evenly distributed? Or is it sparse or even absent?
How well does the litter decompose? Is it in contact with soil and breaking down, or dry and undecomposed? Crumbly, moist litter mixed with soil is good. Floating, dry, or matted litter indicates decomposition is impaired
What about dung? Can you find old and new dung pats? If you see it disappearing within a season, it means you have active decomposers in the field of life. If it is visibly mummified, the nutrient cycle is broken.
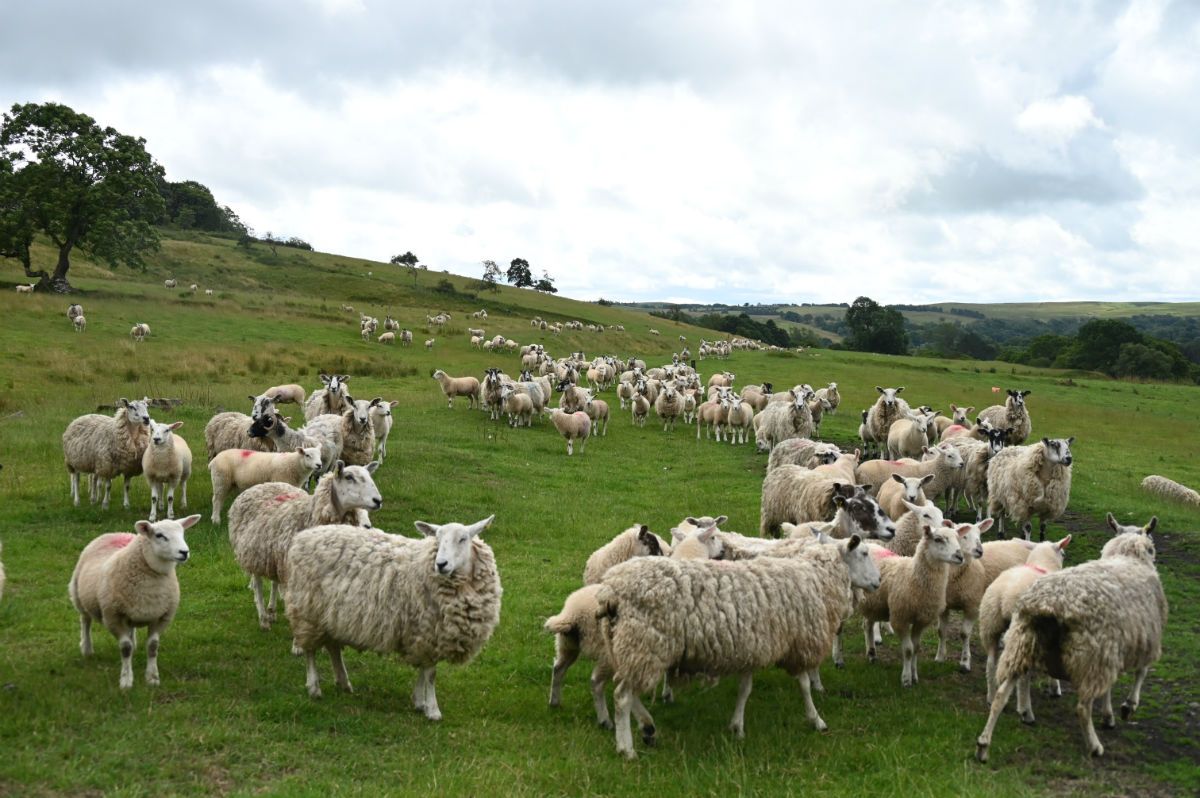
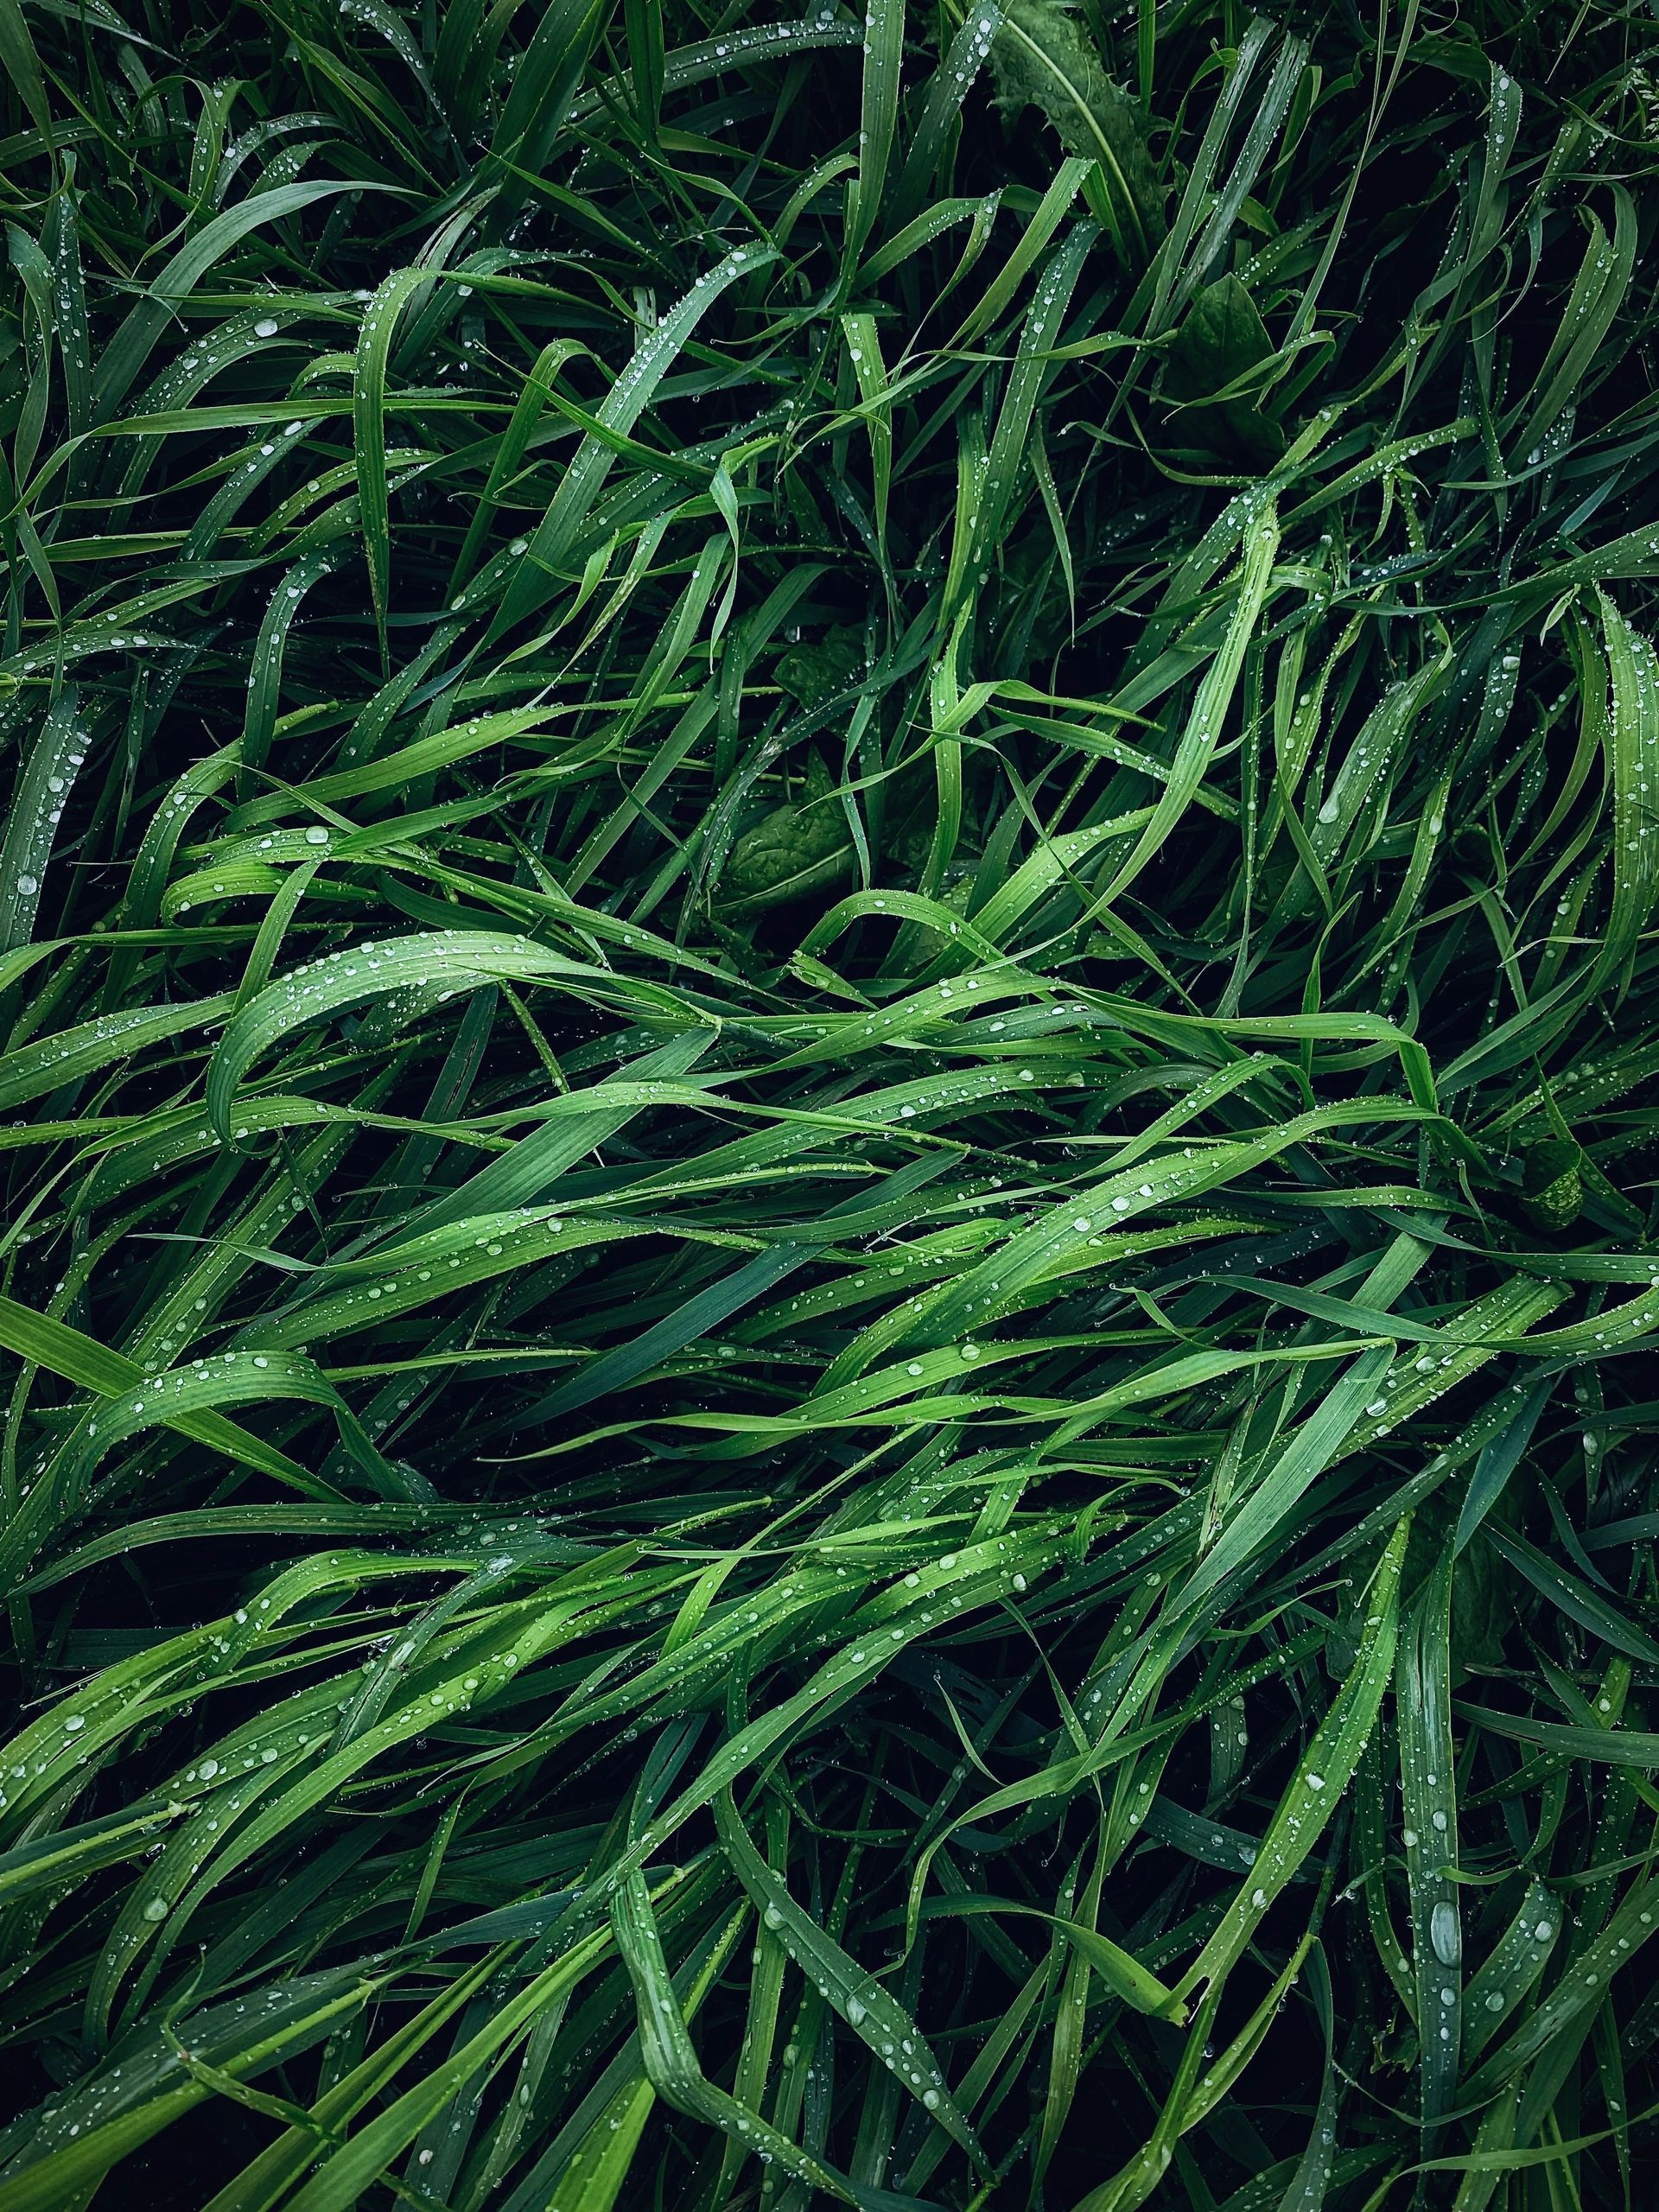
Scan around for the density of green plant cover—especially perennial grasses—distributed evenly across the ground. If the land is healthy, plant leaves will be intercepting most sunlight and filling the vertical space. In unhealthy areas, you’ll find open soil, sparse or patchy cover, and maybe some dominant annuals. The more green photosynthetic tissue you see—especially from perennials—the greater the health measured by the abundance of the living tissue canopy.
How are the plants organised into functional groups, and how dynamic is their interaction? What does plant physiology and life strategy tell us? Do we see warm-season grasses (C4) such as corn/maize, wheat, oats which photosynthesize efficiently in hot, dry conditions? Do cool-season grasses (C3) dominate which thrive in cooler, wetter periods? What of forbs and legumes, the broadleaf herbaceous plants and nitrogen fixers, vital for pollinators and soil fertility? How about trees and shrubs which provide vertical structure, habitat, shade, and deep nutrient cycling?
Healthy ecosystems don’t rely on a single group—they require interplay between groups that maintains soil coverage and photosynthesis, a diversity of rooting strategies, and feedback loops with insects and soil life.
Grasses provide ground cover and intercept sunlight, reducing erosion and increasing carbon fixation. Forbs and legumes fill niches between grasses, adding diversity in structure and nutrient cycling (especially nitrogen-fixation). Shallow-rooted annuals respond quickly to rain and disturbance.
Deep-rooted perennials break compaction, stabilize soils, and access nutrients from subsoil layers. This vertical diversity ensures resilience across seasons and weather patterns.
Different plant groups support different insect functional groups: flowering forbs feed pollinators and parasitoids; grasses house herbivores and predators. Litter from diverse plant groups supports decomposer communities which in turn enrich the soil for all plant life. When one group dominates (e.g., invasive grasses or woody encroachment), feedback loops weaken, often triggering ecological degradation.
And so for the microfauna: kneel down, gently brush any plants aside and look down as far as you can. Healthy land is “alive” with visible activity and the signs left behind by it. If it takes effort to find any signs, you know there is work to be done. There would be dung beetles, ants, worms, insect holes, spider webs, butterflies, and their tunnels and casts and webs and nests. Can you find evidence of the full array of pollinators, predators, parasitoids, decomposers, herbivores, vectors, and generalists? Functional richness in insect life parallels the richness in plant structure—both sustain the self-renewing loops of life.
The higher the functional group richness in plants the greater the variety of functional insect roles. A mixed pasture of Festuca, Trifolium, Plantago, and Scabiosa provides year-round structure, nectar, pollen, and habitat—supporting bees, predatory beetles, and decomposers. If you remove forbs and legumes through overgrazing or reseeding with ryegrass, you collapse trophic cascade and functional complexity, weakening insects and soil feedback loops.
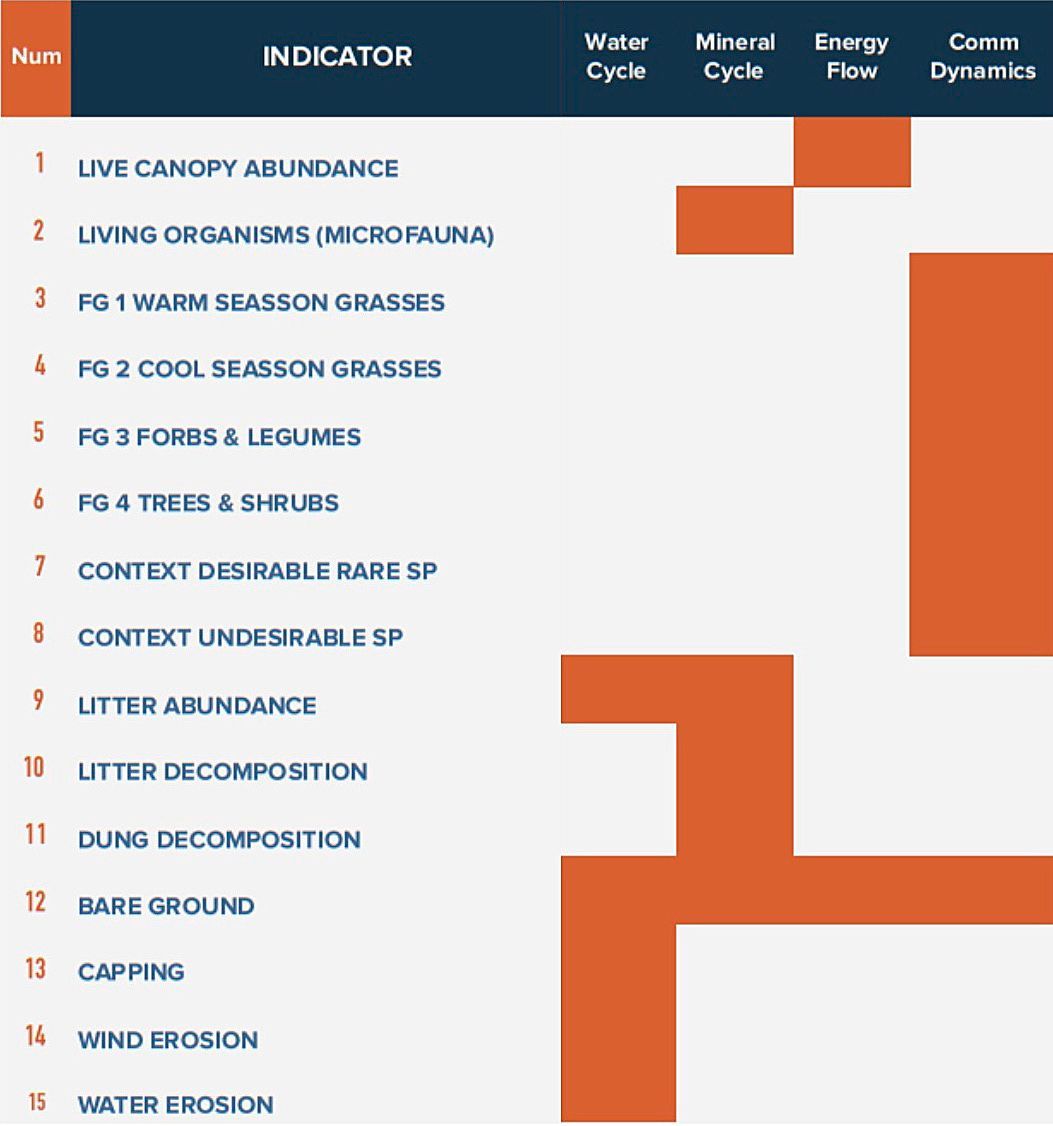
Ecosystem health is not hard to see when you know what you’re looking for. These fifteen indicators and the way they combine are such a powerful framework to tell us about life:
1- Live Canopy Abundance
2- Living Organisms
3- Warm Season Grasses
4- Cool Season Grasses
5- Forbs/Legumes
6- Desirable Trees/Shrubs
7- Contextually Desirable Rare Species
8- Contextually Undesirable Species
9- Litter Abundance
10- Litter Incorporation
11- Dung Decomposition
12- Bare Soil
13- Soil Capping
14- Wind Erosion
15- Water Erosion
Bare soil cuts across all four ecosystem processes: no plants, no solar flow, no water cycle, no mineral cycle, no community (and no dynamics!). Signs of capping and erosion impact the water cycle. Dung and litter decomposition indicate the health of the mineral cycle, whereas the presence of litter in the first place aids the water cycle by softening the impact of water on the ground. The presence or not of functional plant groups and of the desirable and undesirable species is what makes or breaks the community dynamics of life. The abundance of the live canopy of green growing plants is the certain sign of a healthy energy flow, and the presence of microfauna indicates a humming mineral cycle.
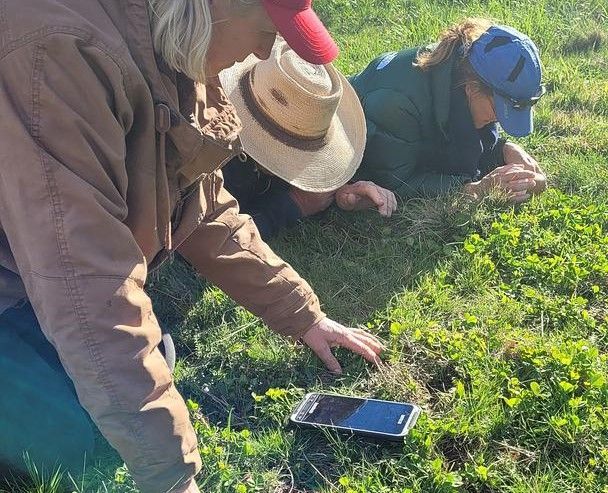
The assessment of the EHI by way of these fifteen indicators against the four ecosystem processes in any ecoregion is made easy with a detailed scorecard.
More Livestock, Not Less, Can Live in Healthier Landscapes
With this way of seeing the land and its life, we can begin to realise, for example, that different ways of grazing livestock can produce a multiple of the biomass through much taller, much more densely growing plants of a much greater variety. We can eradicate the need to import forage from elsewhere including in the winter months, whilst also improving the health of livestock and of the landscape they are grazing.
This change of management also has a huge impact simply on how the land-steward feels about her own ability to relate to life and how they feel about themselves as an agent on behalf of life through farming. More importantly, land with a greater EHI can effectively sustain a greater carrying capacity with greater ecosystem function: more livestock, not less, can live in healthier landscapes if we learn to see with the patterns of life and adopt life-giving rather than degrading management approaches.
References
Savory Institute. (2020). EOV Protocol v2.2 (internal document) for a public understanding of EOV looks like, please see:
-Xu, S. et al. (2019). Ecological Health Index (EHI). Environments, 6(6), 67.
by Marcus Link
New Foundation Farms
May 2025
We can assess the state of your land's health using the Ecological Health Index by doing an on-farm survey called Ecological Outcome Verification or EOV. Find out more: